Open topic with navigation
Pulse Waveform Analysis Using Gates
Note: This feature is available only for power meters and power sensors that support trace charts shown in the Trace display view.
The Gate function allows you to apply a gate on the trace chart to determine the values of the various pulse waveform parameters. Two vertical limit lines are placed on the Trace chart to mark the boundary of the gate. The application supports up to four gates in a graph. You can also use this feature together with Markers.
The following Gate pulse measurement parameters are supported:
- Delta Time
- Average Power
- Peak Power
- Peak-Average (Pk-Avg) Power
- Minimum Power
- Peak-Minimum (Pk-Min) Power
Instructions
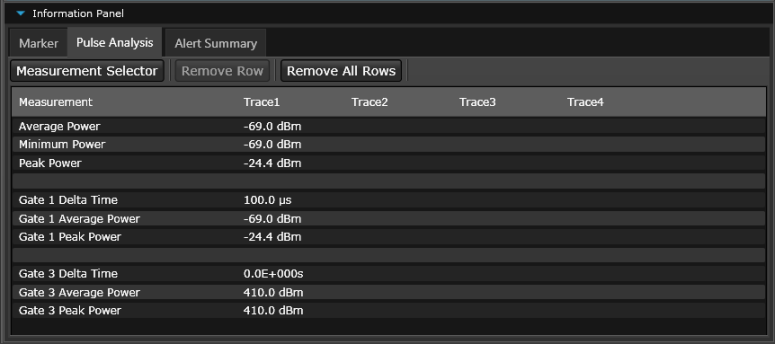
- To read the pulse parameter values, go to the Pulse Analysis tab in the "Information Panel" at the bottom of the Trace display view.
- In the default view, the following three parameters are shown for Gate Measurements: Gate Delta Time, Gate Average Power, and Gate Peak Power.
- To add more parameters to the Pulse Analysis tab, click the "Measurement Selector" button to display the Measurement Selector dialog.
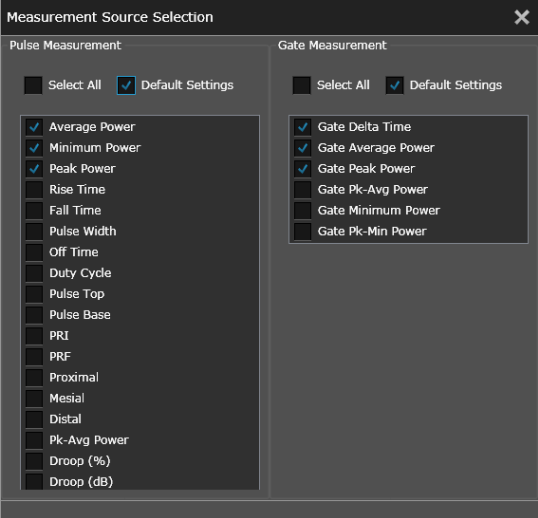
-
Select your desired parameters and click "X" to close the dialog. Your selected parameters will now be added to the Pulse Analysis table (see example below).
-
To remove a specific parameter from the Pulse Analysis table, select a row and click the "Remove Row" button. To clear the entire table, click the "Remove All Rows" button.
See Also
Power Measurements Using Trace View
Pulse Waveform Parameters Overview
Pulse Waveform Parameters Using Markers